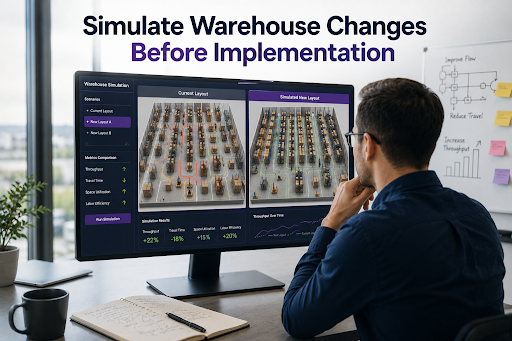
Simulation optimizes warehouse turnaround times by modeling how inventory, workers, equipment, storage locations, and operational rules interact across the facility. It identifies where work is waiting, blocked, or moving inefficiently, allowing teams to test changes before live implementation and reduce end-to-end delays.
The impact can be significant. A 2026 peer-reviewed study of a high-mix forklift assembly warehouse found that discrete-event simulation improved warehouse slotting decisions. Compared with the existing operation, it reduced total cycle time by 14.3%, decreased blocked time by 33.7%, and increased throughput by 7.8%.
This blog explains how simulation identifies warehouse bottlenecks, evaluates operational changes, and improves warehouse turnaround time.
Why Warehouse Turnaround Times Become Increasingly Difficult to Improve
Warehouse turnaround slows as operational dependencies, variability, and system-wide constraints become more difficult to manage.
Local Process Improvements Fail to Reduce End-to-End Delays
Warehouse turnaround time often remains unchanged when improvement efforts focus on individual processes instead of the overall system constraint. This can shift bottlenecks rather than eliminate them, leading to:
- Sub-optimization that moves delays to downstream operations
- The bullwhip effect when upstream suppliers or downstream transportation cannot absorb additional flow
- Behavioral drift, where process improvements gradually lose effectiveness over time
Amazon’s DeepFleet demonstrates this approach. In 2025, Amazon reported more than one million robots and improved robot travel efficiency by 10% through fleet-wide coordination rather than making individual robots faster.
How Process Interdependencies Create Unexpected Turnaround Bottlenecks
Warehouse processes form a tightly coupled chain, so a small delay can create a ripple effect across the facility. Faster receiving, for example, still depends on available staff, inspection capacity, and open putaway locations. Without them, dock staging fills, forklift movement slows, and replenishment is delayed.
The disruption then spreads:
- Empty golden-zone locations cause stockouts and picker delays.
- Wave batching overwhelms packing stations.
- Dispatch staging fills before carrier cutoffs.
These interdependencies become harder to manage as SKU diversity grows. Disconnected WMS and TMS data and peak-season demand further increase queues.
Warehouse process simulation models task priorities, replenishment, labor, equipment, and cutoffs to predict these interactions. Siemens uses this approach at its Nuremberg distribution center. It simulates next-day and extreme-load scenarios to identify bottlenecks before live fulfillment. Synkrato’s 3D digital twin similarly tests warehouse flow before operational changes.
Why Warehouse Variability Makes Turnaround Performance Unpredictable
Average processing time alone cannot explain warehouse turnaround performance. Two processes may average five minutes per task, but greater variation creates a queuing effect, where work arrives faster than it can be processed.
Common sources of variability include:
- Changing order profiles and mixed handling methods
- Fluctuating supplier lead times and inbound arrivals
- Equipment downtime and inventory exceptions
- Priority orders, demand spikes, and worker skill differences
- Rigid WMS rules based on forecast averages
As warehouses grow, diminishing returns, physical space constraints, and functional silos make turnaround performance even less predictable.
Simulation uses probability distributions instead of averages to model normal, peak, and disrupted conditions. Performance is then measured using P50, P90, and P95 turnaround times, queue lengths, work-in-process, and on-time completion rates rather than average task times alone.
The Operational Constraints That Extend Warehouse Turnaround Times
Several operational constraints influence how quickly inventory moves through receiving, storage, picking, and dispatch.
Resource Imbalances Across Receiving, Picking, and Dispatch
Resource imbalances occur when labor, equipment, storage space, and dock capacity are not aligned with the flow of goods across receiving, picking, and dispatch.
Common constraints include:
- Receiving capacity below inbound volume, creating dock congestion and longer trailer turnaround.
- Poor slotting that increases picker travel and lowers throughput.
- Dispatch workloads that are not synchronized with carrier schedules and dock availability.
- Equipment limited by charging, operator availability, or competing tasks.
Low utilization also does not always mean excess capacity. Resources may be waiting because upstream or downstream operations are constrained.
Simulation identifies these imbalances over time and evaluates improvements such as dynamic slotting, cross-trained labor, wave or batch picking, and cross-docking.
Queue Formation During High-Volume Processing
Warehouse queues form when arrival rates exceed processing capacity, causing waiting times to increase rapidly. With the theory of constraints (TOC), the visible queue is rarely the primary problem. Instead, it indicates that an upstream or downstream constraint is limiting overall throughput.
Queues develop at:
- Dock assignment and unloading
- Putaway and conveyor induction
- Packing and dispatch
However, adding resources to the queue rarely solves the problem because the actual constraint often exists elsewhere. To locate the true bottleneck, warehouses should break turnaround into its core components:
Total Turnaround Time = Processing Time + Queue Time + Travel Time + Blocking Time + Exception Time
This breakdown separates active processing from waiting and blocking delays. Simulation then models dock scheduling, ASNs, forklift routing, staging capacity, and packing throughput to identify the real constraint and evaluate improvements using queuing theory before operational changes are made.
Layout and Material Flow Decisions That Increase Cycle Delays
Warehouse layout influences more than travel distance. It determines how efficiently people, equipment, and inventory move through the facility. When layout decisions create conflicting traffic or fragmented material flow, cycle delays increase and overall productivity declines.
Common layout constraints include:
- Receiving and shipping routes crossing each other
- Narrow aisles restricting material handling equipment (MHE)
- Shared forklift and pedestrian traffic
- Poor dock configuration and underutilized vertical storage
- Fragmented inventory systems limiting real-time visibility
As these constraints interact throughout the warehouse, static layout drawings often fail to predict their operational impact. Simulation recreates equipment movement, traffic patterns, and material flow under different conditions to identify bottlenecks before implementation.
For example, PepsiCo uses a digital twin to identify up to 90% of potential issues before physical changes while achieving nearly 100% design validation.
Why Simulation Reveals Bottlenecks That Operational Data Alone Cannot
A warehouse simulation software for operational efficiency explains how warehouse processes interact under different operating conditions.
Evaluating Process Interactions Before Making Operational Changes
Individual KPIs such as picking rate, machine speed, or average cycle time do not always reflect overall warehouse performance because they cannot capture system-wide interactions. Simulation provides a more complete view by identifying:
- Resource contention, blocking, starving, and hidden queues
- Non-linear delays that reduce end-to-end throughput
- Cause-and-effect relationships across warehouse processes
- Whether a proposed change removes the true constraint or simply shifts congestion
- Where resources should be allocated to improve overall warehouse flow instead of isolated activities
Testing Multiple Improvement Scenarios Without Disrupting Live Operations
Warehouse changes should be validated before implementation because testing them in live operations can disrupt customer service and increase operational risk. Simulation provides a risk-free environment to evaluate:
- Layout, staffing, automation, and routing changes before deployment
- Demand surges, equipment failures, and operational variability
- Throughput, service levels, costs, and expected ROI across multiple scenarios
- System errors before go-live, as demonstrated by Ferrero identifying about 95% of issues through virtual commissioning
Synkrato’s simulation & optimization capabilities bring the same simulation-driven approach to day-to-day warehouse decision-making.
System-Wide Effects Instead of Individual Process Performance
Simulation evaluates system-wide performance rather than individual KPIs. It shows how upstream and downstream dependencies, hidden queues, resource contention, blocking, starving, and shifting bottlenecks affect end-to-end warehouse flow while accounting for operational variability.
| Performance Area | Simulation Measures |
| Turnaround | P50, P90, and P95 completion time |
| Flow | Throughput by hour and process |
| Queues | Average and maximum queue length |
| Resources | Busy, idle, blocked, and starved time |
| Service | Orders completed before the cutoff |
| Cost | Labor, equipment, and overtime |
| Resilience | Performance during demand spikes and equipment failures |
The best scenario improves overall warehouse flow without creating new bottlenecks or increasing operational risk.
The Business Impact of Faster Warehouse Turnaround Times
Warehouse turnaround time optimization improves more than operational speed. It also increases throughput, resource efficiency, and overall warehouse stability.
- Improved Order Flow Across Warehouse Operations:
Faster turnaround improves the flow of inventory, equipment, and labor across the warehouse. Docks, staging areas, and handling equipment become available sooner, while work-in-process remains at stable levels. Simulation helps determine the optimal work-in-process required to maximize throughput without creating downstream delays.
- Higher Throughput Without Proportional Resource Expansion
Higher throughput does not always require more labor or equipment. Simulation identifies hidden capacity by optimizing release timing, labor allocation, equipment utilization, and process sequencing. This increases completed output while making better use of existing resources.
- Greater Operational Stability During Demand Fluctuations
Simulation evaluates warehouse performance under demand spikes, equipment failures, labor shortages, late inbound deliveries, and changing carrier cutoffs before they occur. For example, BSH uses a digital twin across 188 warehouses, reducing network study time by about 50% while validating operational decisions before implementation.
When Simulation Becomes Critical for Turnaround Time Optimization
Certain operational conditions indicate that simulation is needed to support reliable warehouse decision-making.
Performance Improvements Have Reached a Plateau
When improvement projects deliver diminishing returns, the underlying constraint is usually systemic rather than local. Common warning signs include:
- More labor without higher completed output
- Frequently shifting bottlenecks
- Persistent overtime despite available capacity
- New equipment delivering limited operational gains
- Daily supervisor interventions to maintain flow
Warehouse Complexity Outpaces Traditional Improvement Methods
As warehouse complexity increases, cause-and-effect relationships become harder to predict manually. Simulation becomes valuable when operations include:
- Multiple fulfillment channels and automation technologies
- Shared inventory and synchronized workflows
- Diverse handling requirements and service commitments
- Complex routing, sequencing, and processing rules
Instead of relying on assumptions, simulation evaluates how these interacting variables influence overall warehouse behavior.
Operational Decisions Require Risk-Free Validation Before Execution
High-impact operational decisions should be validated before implementation to reduce execution risk. This is especially important for:
- Layout changes
- Automation investments
- Warehouse expansion
- WMS logic
- Staffing models
- Process redesigns
A reliable validation process should verify that the proposed design reproduces current operational behavior, stress-test multiple demand and disruption scenarios, and confirm that decision rules, resource policies, and process interactions remain stable before deployment. This reduces rework, improves implementation confidence, and supports more reliable capital investment decisions.
How Synkrato Enables Faster Warehouse Turnaround Times
To reduce warehouse turnaround time, organizations need a platform that can evaluate operational scenarios, predict bottlenecks, and validate decisions before changes are implemented. Synkrato transforms warehouse data into an AI-driven decision-making platform that helps teams optimize turnaround times with confidence.
With Synkrato, warehouses can:
- Simulate layouts, labor, equipment, and inventory changes using a 3D Digital Twin.
- Evaluate AI-driven scenarios to identify the best operational strategy.
- Continuously optimize slotting, warehouse flow, and resource allocation.
- Gain real-time operational visibility and automate decision-making with AI Agents.
- Improve execution accuracy through enterprise mobility and centralized labeling.
Rather than optimizing individual processes, Synkrato helps warehouses improve end-to-end operational flow through simulation, AI, and predictive optimization.
Book a demo to explore a smarter approach to warehouse turnaround optimization.
FAQs
How does Synkrato use simulation to improve warehouse turnaround times?
Synkrato uses a 3D digital twin to simulate warehouse operations before changes are implemented. It evaluates layouts, labor allocation, equipment usage, slotting strategies, and material flow under different scenarios, helping teams identify bottlenecks, validate improvements, and optimize turnaround times without disrupting live operations.
Why do warehouse turnaround times remain high despite continuous process improvements?
Warehouse turnaround times often remain high because isolated process improvements simply shift bottlenecks elsewhere. Variability in demand, resource constraints, layout limitations, and dependencies between receiving, picking, packing, and dispatch reduce the impact of local optimizations, making system-wide evaluation necessary.
Can Synkrato identify operational bottlenecks before they impact turnaround performance?
Yes. Synkrato combines AI, simulation, and real-time operational data to identify emerging bottlenecks before they affect throughput. Teams can evaluate different operational scenarios, understand how constraints interact, and take corrective action before delays impact warehouse performance.
Why is simulation more reliable than a trial-and-error process change?
Trial-and-error testing disrupts live operations and introduces operational risk. Simulation evaluates multiple what-if scenarios in a virtual environment, allowing warehouses to predict bottlenecks, validate process changes, and compare outcomes before making physical or operational changes.
How does Synkrato validate warehouse improvement strategies using simulation?
Synkrato recreates warehouse operations in a virtual environment and tests different layouts, labor plans, slotting strategies, automation initiatives, and workflow changes. Comparing simulated outcomes before implementation helps warehouses select the most effective strategy with lower operational risk.
Which KPIs should be monitored to evaluate turnaround time improvements?
Warehouse turnaround should be measured using turnaround time, dock-to-stock time, order cycle time, throughput, and work-in-process (WIP). Additional KPIs such as queue length, on-time shipment rate, and labor and equipment utilization help evaluate operational stability beyond average processing time.