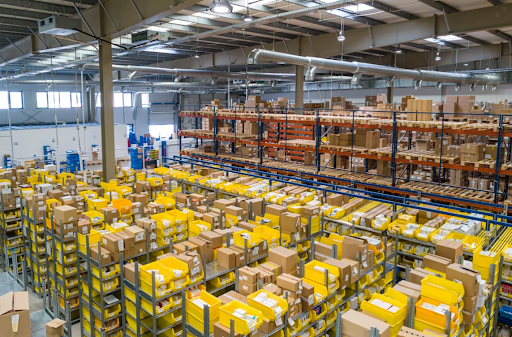
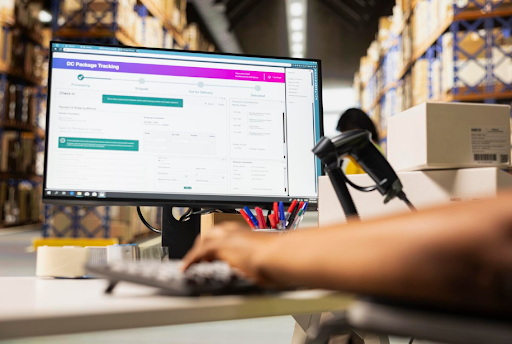
Warehouse dashboard samples improve warehouse visibility by showing where inventory, orders, labor, capacity, and material flow are moving away from the plan. The most useful dashboards connect operational signals so managers can identify what is causing a delay and decide what to change.
That counts as fulfillment volume grows. In Q2 2026, U.S. e-commerce sales reached $340.2 billion, up 12.2% year over year, and represented 17.1% of total retail sales.
The following warehouse dashboard templates focus on the decisions operations teams need to make as that complexity increases.
Warehouse Operations Dashboard
A warehouse operations dashboard is a centralized view of live fulfillment, inventory, labor, capacity, and equipment performance across the facility.
Purpose: It connects receiving, putaway, inventory control, fulfillment, and shipping data so managers can identify where operational problems originate.
Key Metrics:
- Order Accuracy: Picking and packing correctness.
- On-Time Shipping: Orders shipped by the required deadline.
- Dock-to-Stock Time: Time from receipt to inventory availability.
- Labor Productivity: Units processed against labor hours.
- Capacity Utilization: Used versus available warehouse capacity.
Benefits:
- Detect growing picking, receiving, or shipping backlogs.
- Identify labor and equipment constraints.
- Prioritize operational exceptions before they affect fulfillment.
Featured Insights: In 2025, DHL operated 7,500+ robots and nearly 800,000 IoT sensors, with 90%+ of its warehouses using automation or digitalization. As operations become more connected, Synkrato’s 3D Digital Twin helps teams visualize inventory, equipment, and workflows in one virtual warehouse environment.
Warehouse Inventory Dashboard
A warehouse inventory dashboard displays real-time stock levels, inventory values, locations, and product performance to reveal availability and inventory risks.
Purpose: It connects inventory quantity with location, velocity, age, demand, and transaction history to identify stock problems early.
Key Metrics:
- Inventory Accuracy: Physical stock versus system records.
- Inventory Turnover & Days of Inventory: How quickly inventory moves.
- Low Stock / Reorder Alerts: Items approaching stockout thresholds.
- Obsolete Stock Percentage: Aging or slow-moving inventory.
Benefits:
- Detect stockout and excess-inventory risks.
- Prioritize inventory exceptions.
- Reduce time spent investigating location discrepancies.
Featured Insights: By 2024, IKEA operated 250+ autonomous drones across 73 locations in nine countries for inventory checks. This shows how continuous physical inventory visibility can strengthen dashboard data.
Warehouse Receiving Dashboard
A warehouse receiving dashboard tracks inbound shipments, dock productivity, and putaway progress in real time to identify congestion before it affects inventory availability.
Purpose: It separates delays across unloading, inspection, staging, putaway, and system processing.
Key Metrics:
- Dock-to-Stock Time: Arrival to inventory availability.
- Daily Pallet Intake: Pallets received versus processed.
- Putaway Status: Stored versus waiting inventory.
- Supplier Quality & Accuracy Rate: Damaged, incorrect, or mismatched deliveries.
- Labor & Forklift Workload: Active tasks by operator or equipment.
Benefits:
- Detect receiving-floor congestion.
- Identify supplier-related delays.
- Balance labor and forklift workloads.
- Prevent putaway backlogs from affecting fulfillment.
Featured Insights: Amazon reported that Sequoia could identify and store received inventory up to 75% faster, showing why receiving velocity directly affects downstream availability.
Warehouse Picking Dashboard
A warehouse picking dashboard tracks real-time order fulfillment, picker productivity, queues, and error rates to identify where picking performance falls behind plan.
Purpose: It separates productive picking from travel, waiting, replenishment delays, congestion, and errors.
Key Metrics:
- Order Picking Accuracy: Items picked the first time correctly.
- Units Picked per Hour: Individual or team productivity.
- Lines Picked per Hour: Distinct order lines processed.
- Order Status Breakdown: Orders not started, in progress, or completed.
- Picker Performance Ratings: Productivity and errors by shift.
Benefits:
- Detect growing picking queues.
- Identify productivity constraints.
- Reduce picking errors.
Featured Insights: At its Taoyuan International Logistics Center, UPS reported that AMRs reduced picking errors to near zero and could help double productivity. Building on this, Synkrato’s AI Slotting optimizes SKU placement using demand and movement patterns to reduce picking travel.
Warehouse Packing Dashboard
A warehouse packing dashboard identifies whether completed picks are moving through packing fast enough to protect shipping cutoffs.
Purpose: It connects pack-station workload with order complexity, staffing, packaging availability, and outbound deadlines.
Key metrics include:
- Orders awaiting packing
- Pack cycle time
- Units per pack station
- Packaging exceptions
Benefits: Supervisors can open capacity, redistribute work, or investigate abnormal order profiles before the backlog reaches shipping.
Featured Insights: At UPS, orders handled through its AMR-supported process could be processed and packed onto shelves approximately 40% faster than previous processing speeds. That improvement shows why packing dashboards should measure queue-to-completion time rather than pack-station output alone.
Warehouse Shipping Dashboard
A warehouse shipping dashboard is a centralized view of real-time fulfillment, shipment status, carrier performance, and delivery metrics for protecting shipping deadlines.
Purpose: It connects staging, sortation, carrier, dock, and order-priority data to identify orders at risk of missing the cutoff.
Key Metrics:
- Shipment Volume & Status: Orders shipped, delayed, canceled, or in transit.
- Order Pipeline: Orders picked, packed, and staged.
- Delivery Performance: On-time delivery and transit times.
- Carrier Insights: Cost, capacity, and transit time by carrier.
- Sortation Throughput: Packages processed over time.
Benefits:
- Detect outbound bottlenecks.
- Prioritize cutoff-risk orders.
- Compare carrier performance.
Featured Insights: FedEx‘s 2025 Laem Chabang facility can sort up to 3,000 packages per hour, making short-term capacity and exception visibility critical.
Warehouse Labor Dashboard
A warehouse labor dashboard tracks worker productivity, staffing levels, utilization, and task completion times in real time to show whether labor matches operational demand.
Purpose: It connects workforce availability with workload, backlog, performance, and automation capacity.
Key Metrics:
- Labor Productivity: Units, lines, or orders processed per hour.
- Headcount & Attendance: Available workers by shift.
- Labor Utilization: Active versus idle or waiting time.
- Performance vs. Standards: Actual task time against labor standards.
- Accuracy & Errors: Errors by worker or shift.
Benefits:
- Identify staffing and allocation gaps.
- Separate labor shortages from workflow constraints.
- Reallocate workers as demand changes.
Featured Insights: In 2025, Amazon reached one million robots across 300+ facilities and upskilled 700,000+ employees, showing why labor dashboards need human and automation capacity together.
Warehouse Order Fulfillment Dashboard
A warehouse order fulfillment dashboard combines real-time inventory, picking, packing, and shipping data to show whether orders will meet promised service levels.
Purpose: It connects allocation, picking, packing, staging, and shipping into one order timeline.
Key Metrics:
- Order Fulfillment Rate: Orders fulfilled versus total orders.
- Order Cycle Time: Order placement to shipment.
- Pick, Pack, and Ship Efficiency: Throughput by hour or shift.
- Order Picking Accuracy: Error-free picks.
- Backorders and Delays: Orders stalled by stockouts or process delays.
Benefits:
- Identify fulfillment bottlenecks.
- Prioritize orders at risk.
- Trace delays to specific stages.
Featured Insights: In FY2025, Ocado shipped 72 million orders globally, while its most advanced fulfillment center picked about 50% of the volume robotically. It reinforces the need to track orders across human and automated workflows.
Warehouse Capacity Dashboard
A warehouse capacity dashboard tracks physical space, storage utilization, and inventory volume to show how much usable operational capacity remains.
Purpose: It reveals when zones, racks, pick faces, or automation areas are approaching constraints despite available facility space.
Key Metrics:
- Capacity Utilization Rate: Used versus available storage capacity.
- Open vs. Occupied Locations: Available and filled bins, racks, or slots.
- Held Units by Category: Inventory volume by product type.
- Pallet and Container Tracking: Incoming, putaway, and stored pallets.
- Days on Hand: Inventory coverage based on current stock and movement.
Benefits:
- Detect capacity constraints early.
- Identify underused storage areas.
- Improve inventory placement.
Featured Insights: Walmart added 500,000+ sq.ft. of automation to each of four U.S. perishable distribution centers, demonstrating why productive capacity helps beyond occupied space.
Warehouse Bottleneck Dashboard
A warehouse bottleneck dashboard tracks real-time workflow delays, backlogs, congestion, and resource constraints to identify what is restricting warehouse throughput.
Purpose: It detects where inventory, orders, equipment, or labor stop flowing normally.
Key Metrics:
- Dock-to-Stock Time: Inbound receipt to picking availability.
- Open Pick Tickets by Zone: Unfulfilled picks by location.
- Forklift and Equipment Utilization: Active versus idle equipment.
- Order Cycle Time: Order placement to outbound loading.
- Labor Productivity: Units processed per hour.
- Queue Time: Waiting time by process.
Benefits:
- Detect localized congestion.
- Trace delays to specific resources.
- Intervene before SLA failures.
Featured Insights: Amazon‘s 2025 DeepFleet targets 10% better robot travel efficiency. Similarly, Synkrato’s AI Agents can identify bottlenecks and test corrective changes within a digital twin before physical implementation.
Improve Warehouse Dashboard Visibility With Synkrato
Synkrato helps to move beyond static dashboards by connecting operational data with real-time warehouse visibility and decision support.
Thus, teams can:
- Monitor inventory, labor, fulfillment, capacity, and material flow together.
- Understand how problems in one warehouse process affect another.
- Turn dashboard insights into faster operational decisions.
Book a demo with Synkrato to see how connected warehouse visibility can make your dashboards more actionable.
FAQs
What is a warehouse dashboard?
A warehouse dashboard combines operational metrics such as inventory, throughput, labor, capacity, and order status into a decision view. More advanced dashboards also expose exceptions and relationships between processes rather than displaying isolated KPIs.
How does Synkrato improve warehouse visibility?
Synkrato creates a continuously connected view using warehouse data and a 3D digital twin. Teams can visualize operations, identify bottlenecks, simulate changes, and evaluate likely outcomes before implementing them physically.
What should a warehouse dashboard include?
A warehouse dashboard should include metrics tied to the decision being made, such as throughput, backlog, cycle time, inventory accuracy, capacity, labor, and exceptions. Synkrato adds simulation so teams can evaluate potential corrective actions.
Can Synkrato connect warehouse data from different systems?
Yes. Synkrato’s AI Agents can connect information from ERP, WMS, digital twins, scans, and other structured or unstructured warehouse data sources to provide operational answers through one interface.
How often should a warehouse dashboard be updated?
Operational dashboards should update frequently enough to expose a problem before it affects downstream processes. For active warehouse flow, Synkrato supports real-time visibility so managers can evaluate changing inventory, labor, and workflow conditions.
How does Synkrato use AI to support warehouse decisions?
Synkrato uses AI Agents, digital twins, simulation, and optimization to analyze warehouse conditions and recommend actions. Teams can test scenarios involving labor, slotting, flow, layouts, or bottlenecks before putting inventory or operations at risk.