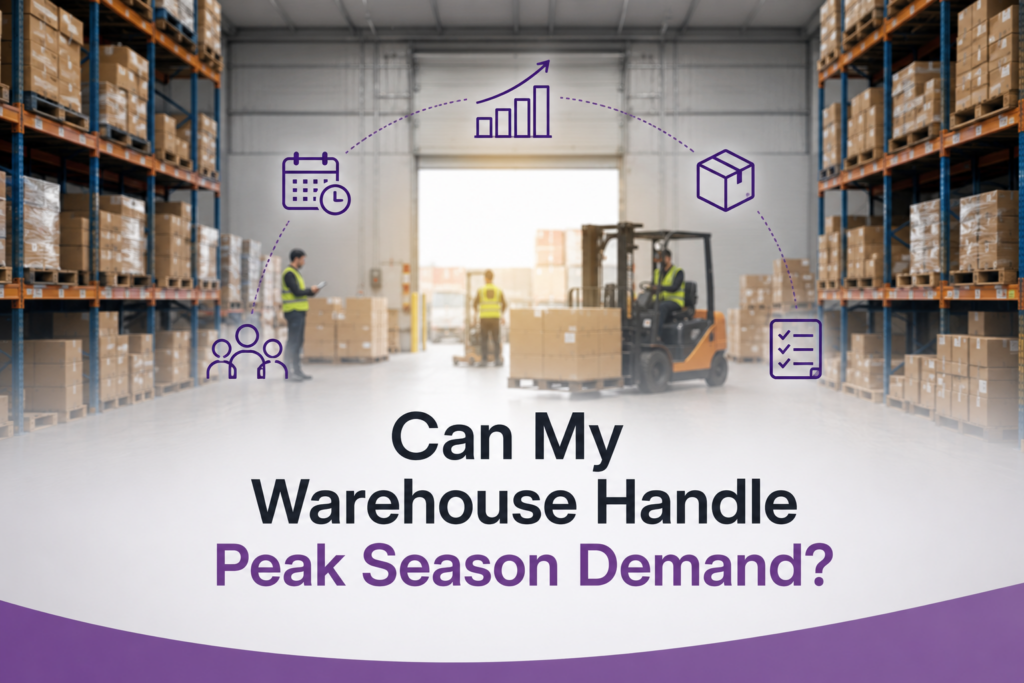
A warehouse can handle peak season demand only when inventory, labor, systems, and fulfillment flow can absorb higher volume without creating bottlenecks. Readiness depends on how quickly stock becomes usable, how accurately work moves through each step, and how early teams detect capacity pressure.
This pressure is already visible across logistics networks. In May 2026, the Logistics Managers’ Index reached 69.5, showing continued U.S. logistics expansion. At the same time, inventory costs rose to 84.1, the highest level since May 2022, while warehousing capacity was only in mild expansion at 50.5. This gap shows why warehouses need stronger control over flow, space, and execution before demand rises.
This article explains the factors that determine peak season readiness and how to evaluate whether warehouse systems can sustain higher demand.
Why Peak Season Exposes Operational Weaknesses That Remain Hidden Year-Round?
Peak season reveals hidden operational weaknesses that affect warehouse stability and throughput. The following factors explain where these vulnerabilities typically emerge.
Why Stable Operations Can Collapse Under Temporary Demand Surges?
As transaction volumes increase, maintaining throughput requires additional processing capacity rather than simply adding labor. Maintaining warehouse throughput during peak season depends on balancing labor, equipment, inventory flow, and available processing capacity.
This is reflected in how large parcel networks prepare for seasonal demand. For the 2025 holiday season, the USPS expanded its daily package processing capacity from 60 million to 88 million packages through additional automated sortation and barcode scanning systems. At the warehouse level, similar pressures usually appear as:
- Capacity constraints: Over time, equipment, dock doors, and packing stations eventually reach their throughput limits.
- The bullwhip effect: Small demand increases trigger larger replenishment orders upstream, creating inventory imbalances.
- Supply chain constraints: Raw material shortages, limited carrier capacity, and transportation delays reduce fulfillment performance even when warehouse operations remain productive.
As warehouse complexity increases, identifying the root cause of delays becomes more difficult. Synkrato‘s AI Agents analyze data from across warehouse systems and present actionable insights through a conversational interface.
How Small Process Inefficiencies Compound During Peak Volume?
A five-second delay may seem insignificant until it happens thousands of times during peak season. Moreover, if one process takes 10% longer than planned, the next process is on hold.
As these delays accumulate, they affect warehouse operations in several ways:
- Shared resources such as scanners, packing stations, and staging areas become congested.
- Teams rush to recover lost time, increasing errors, rework, and inventory corrections.
- Growing workloads, consumed by backlogs, contribute to employee fatigue, reducing productivity over longer shifts.
Decathlon demonstrates the value of removing these micro-delays. Before implementing RFID, verifying a product took about 12 seconds using barcode scanning and manual data entry. RFID reduced the process to less than three seconds per item.
Why Historical Performance Often Fails to Predict Peak Readiness?
Historical data reflects what worked under a specific set of circumstances, but peak demand changes order profiles, SKU velocity, labor availability, carrier capacity, and customer expectations. Accurate warehouse demand forecasting for peak season helps businesses anticipate these changes before they affect operations.
Historical performance often fails to predict future readiness because:
- Peak demand is non-linear, where small changes in order volume or inventory flow can quickly reduce warehouse throughput.
- Past success may create survivorship bias, causing businesses to focus on successful outcomes while overlooking the operational issues that occurred during previous peak seasons.
- Historical results can also create an illusion of control, leading teams to assume existing processes will perform similarly despite changing conditions.
The Capacity Constraints That Determine Peak Season Performance
Sustaining higher-order volumes requires more than additional space or labor. Continuous flow, shared resource capacity, and execution accuracy determine how much work a warehouse can process without creating bottlenecks.
Flow Imbalances Across Receiving, Picking, Packing, and Shipping
Peak planning should begin with flow balance. For instance,
- Receiving and putaway should determine how quickly inventory becomes available.
- Replenishment must keep fast-moving SKUs available, while poor slotting increases picking time.
- Packing should control cartonization, labeling, and documentation.
- Shipping depends on efficient carrier staging and cut-off compliance.
Maintaining balanced flow requires ABC slotting, wave picking, cross-trained labor, and barcode scanning at every touchpoint. Without accurate scans, the WMS may show inventory as available even when pickers cannot locate it, or shipments cannot be verified.
Resource Dependencies That Create Hidden Throughput Limits
A warehouse rarely runs out of only one resource. Hidden throughput limits occur when shared resource dependencies, such as labor, scanners, printers, staging space, or replenishment capacity, create queues that reduce overall throughput.
These constraints often remain hidden because departments are measured separately. Peak readiness depends on identifying where shared resources reach their capacity limits and begin creating bottlenecks across the warehouse.
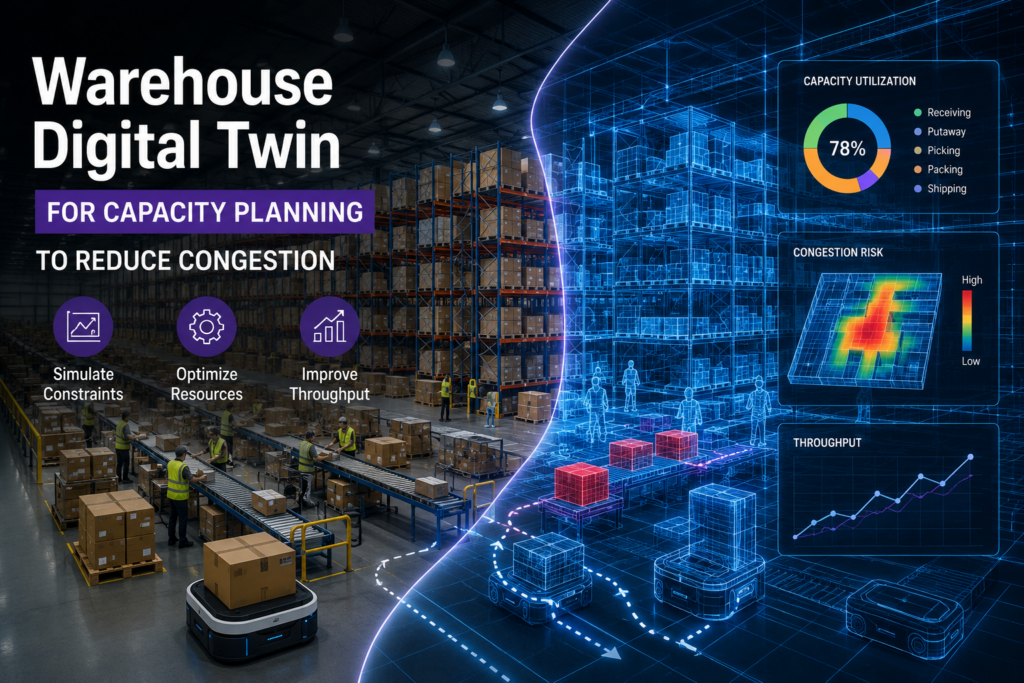
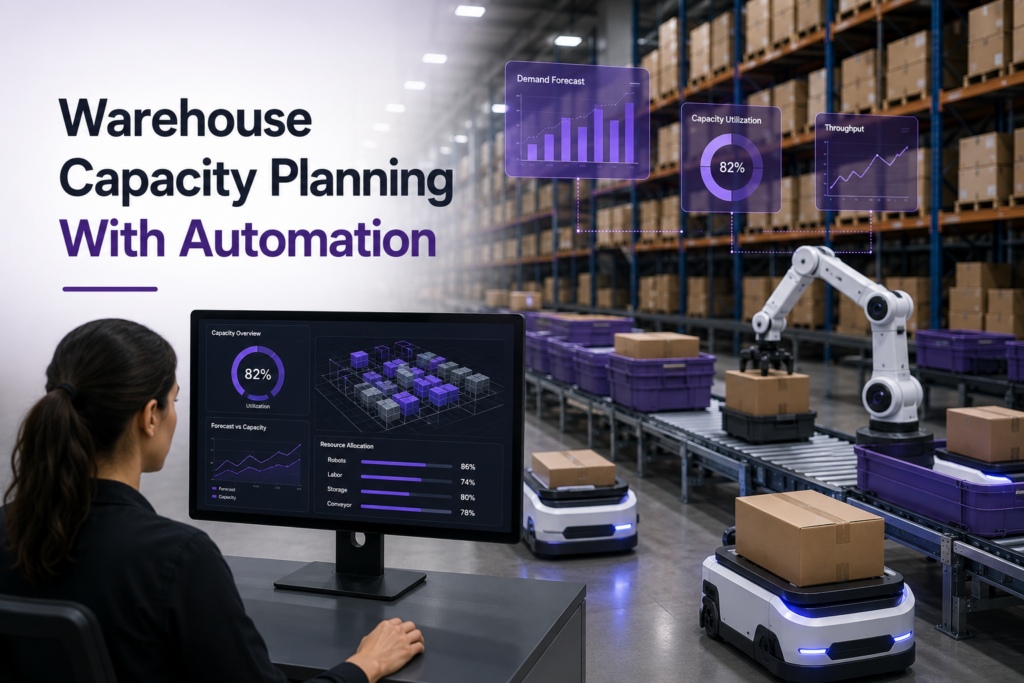
For instance, spike testing, scenario planning, and simulation help identify hidden capacity constraints before peak season begins. Synkrato uses simulation & optimization and AI slotting to identify bottlenecks before they impact throughput.
Why Inventory Availability Alone Doesn’t Guarantee Fulfillment Readiness?
Having stock is not the same as being ready to fulfill. Inventory availability confirms that stock exists, while fulfillment readiness depends on whether it can move through picking, packing, and shipping without delays.
Inventory can become unavailable because of:
- Phantom inventory, damaged or quarantined stock, incorrect locations, or the wrong lot or barcode.
- Delayed WMS updates, disconnected inventory, labor shortages, slotting inefficiencies, carrier delays, or compliance holds.
Improving traceability helps reduce many of these fulfillment risks. For example, Fresenius Kabi enhanced labels across 700+ products using GS1 DataMatrix barcodes. They capture a product identifier, batch/lot number, and expiration date, while providing more accurate product visibility across the supply chain.
How Operational Variability Changes During Peak Demand
Operational variability increases when multiple warehouse conditions change at the same time. Shifting order patterns, changing inventory movement, and resource fluctuations make warehouse execution less predictable and more difficult to control.
Order Mix Shifts That Disrupt Warehouse Execution
Peak demand often changes what customers buy and how they buy it. A warehouse that normally ships full cases may suddenly process more each-picks, DTC orders, promotional kits, or multi-line orders. These order mix shifts create profile mismatches that increase travel time, unbalance labor, and create bottlenecks across warehouse operations.
Common operational impacts include:
- Picking zones become congested as each-picking replaces full-case or pallet picking.
- Staging areas overflow when orders are released faster than packing can process them.
- Packing and shipping require more sorting and consolidation, increasing the risk of missed carrier cut-offs.
Maintaining throughput requires dynamic order release, dynamic tasking, and better coordination between the WMS, TMS, inventory, labor, and equipment.
SKU Velocity Changes That Challenge Existing Workflows
Changes in SKU velocity can disrupt established warehouse workflows. Slow movers become fast movers, demand shifts across channels, and new products may have little historical data.
It creates the following challenges:
- Static slotting increases pick travel time when high-velocity SKUs remain in low-priority locations.
- Delayed inventory replenishment and static reorder planning increase the risk of stockouts or excess inventory.
- Fragmented storage and overflow locations reduce picking efficiency as SKU movement changes.
This is where AI slotting and simulation & optimization become valuable. Warehouses can model different demand scenarios, optimize storage locations, and adjust replenishment strategies before bottlenecks affect throughput.
Barcode scan history provides the movement data needed to identify changing SKU velocity, predict congestion, and recommend slotting improvements before peak demand reaches the warehouse.
The Impact of Labor, Carrier, and Inventory Variability on Service Levels
Labor, carrier, and inventory variability often occur together and increase the risk of missed on-time in full (OTIF) targets, lower fill rates, and higher fulfillment costs. For instance,
- Labor shortages slow picking and packing
- Carrier variability compresses shipping windows
- Inventory variability creates delays caused by inaccurate stock records or unavailable inventory.
Labor pressure also affects operational performance. According to the U.S. Bureau of Labor Statistics, the 2024 warehousing and storage industry recorded 4.8 recordable injury and illness cases per 100 full-time workers. As workloads increase, excess walking, rushed picking, rework, and manual exception handling can further reduce productivity.
Evaluating Whether Existing Warehouse Systems Can Sustain Peak Demand
Warehouse peak season readiness assessment requires understanding not only current performance but also how operations respond as demand approaches capacity limits. This helps identify where stability begins to decline before fulfillment is affected. It also helps businesses evaluate warehouse scalability for seasonal demand before operational constraints begin affecting fulfillment performance.
Identifying Performance Thresholds Before Operations Become Unstable
Warehouse instability rarely happens all at once. It usually appears as small performance changes before causing missed SLAs, growing backlogs, and lower throughput.
Key thresholds should be monitored across the warehouse, including:
- Scan compliance by process step
- Receiving-to-available time and dock-to-stock time
- Putaway aging and pick task aging
- Replenishment response time
- Pack station utilization
- Printer and label failure rate
- Order exception backlog
- Carrier cut-off risk
- Dock staging occupancy
- Labor productivity, order picking accuracy, and space utilization
Testing Operational Resilience Under Different Demand Scenarios
Operational resilience is evaluated by testing how the warehouse performs when demand, labor, inventory, or transportation conditions change unexpectedly.
A comprehensive scenario test should include:
- Demand surge: Can the warehouse maintain throughput if inbound or outbound volume rises sharply while labor remains unchanged?
- Volatile mix: Can existing slotting, picking, and replenishment processes adapt when SKU velocity or order profiles change?
- Compound disruption: How does the warehouse perform if higher order volumes coincide with carrier delays, barcode label issues, or equipment downtime?
Each scenario should then be evaluated against key operational measures such as labor flexibility, order processing time, and inventory constraints. Synkrato’s Enterprise Mobility allows businesses to stress-test warehouse operations, evaluate different demand scenarios, and identify operational weaknesses before peak demand exposes them.
Recognizing Early Indicators of Capacity Saturation
Warehouse capacity usually reaches its limit before storage space is completely full. Early signs often appear on the warehouse floor, where material flow becomes slower and manual workarounds become more common.
Common indicators include:
- Floor-stacked inventory, overflow storage, and narrowed aisles that reduce forklift movement and picking efficiency.
- Longer travel distances as operators search for inventory or work around congestion.
- Increasing product damage caused by overcrowded storage locations and limited maneuvering space.
- Frequent ad-hoc storage locations that reduce inventory visibility and increase cycle-count variances.
How Synkrato Helps Identify When Peak Season Readiness Requires Strategic Change?
Peak season often exposes operational issues that temporary fixes cannot solve. Synkrato helps businesses determine whether recurring bottlenecks require strategic changes before they affect warehouse performance. Here’s how.
- Recurring seasonal performance declines despite ongoing process improvements. Synkrato’s Digital Twin allows teams to evaluate layout and workflow changes before implementing them.
- Order growth exceeding current warehouse capacity. AI-driven slotting recommendations from Synkrato help optimize inventory placement as demand patterns evolve.
- Operational constraints spanning multiple warehouse functions. Synkrato’s simulation capabilities help validate broader operational improvements before changes are made on the warehouse floor.
Book an appointment with Synkrato to evaluate warehouse readiness, uncover operational bottlenecks, and test improvement strategies before implementing them.
FAQs
How does Synkrato help businesses assess whether their warehouse is ready for peak season demand?
Synkrato helps businesses assess peak readiness by turning warehouse data into a 3D digital twin, where teams can test layouts, labor plans, slotting changes, and demand scenarios before making physical changes. The platform uses WMS and facility data to support AI-driven recommendations and operational decisions.
What are the earliest indicators that a warehouse may struggle during peak season?
The earliest warning signs include rising dock-to-stock time, slower picking, growing replenishment delays, order exceptions, scan errors, packing congestion, and missed carrier cut-offs. Synkrato gives teams better visibility into these signals by connecting real-time warehouse activity with AI-driven insights across inventory, movement, labor, and fulfillment flow.
Can Synkrato identify operational bottlenecks before peak season impacts warehouse performance?
Yes. With Synkrato’s digital twin and simulation & optimization tools, warehouse teams can test demand surges, layout changes, slotting plans, and seasonal equipment needs before peak volume reaches the floor. This helps identify bottlenecks in receiving, picking, packing, replenishment, or shipping before they affect service levels.
How can businesses assess warehouse readiness before peak demand begins?
Businesses should review peak readiness by testing throughput, labor capacity, inventory accuracy, pick performance, replenishment speed, packing flow, and carrier cut-off risk. Demand scenarios can be simulated with Synkrato to identify bottlenecks and assess whether the warehouse can sustain higher seasonal volumes.
How does Synkrato support scenario analysis for peak season warehouse planning?
Synkrato’s scenario planning capabilities let teams preview changes such as new rack layouts, floor setup changes, automation options, seasonal staffing shifts, and increased SKU demand inside a virtual warehouse model. This gives leaders a safer way to compare decisions before moving inventory, changing workflows, or committing resources.
Which warehouse KPIs provide the clearest indication of peak season readiness?
Key KPIs include throughput, inventory accuracy, order cycle time, OTIF, fill rate, labor productivity, pick accuracy, dock utilization, and warehouse capacity utilization. Synkrato helps monitor these KPIs in one view, making it easier to evaluate overall warehouse readiness before demand increases.